
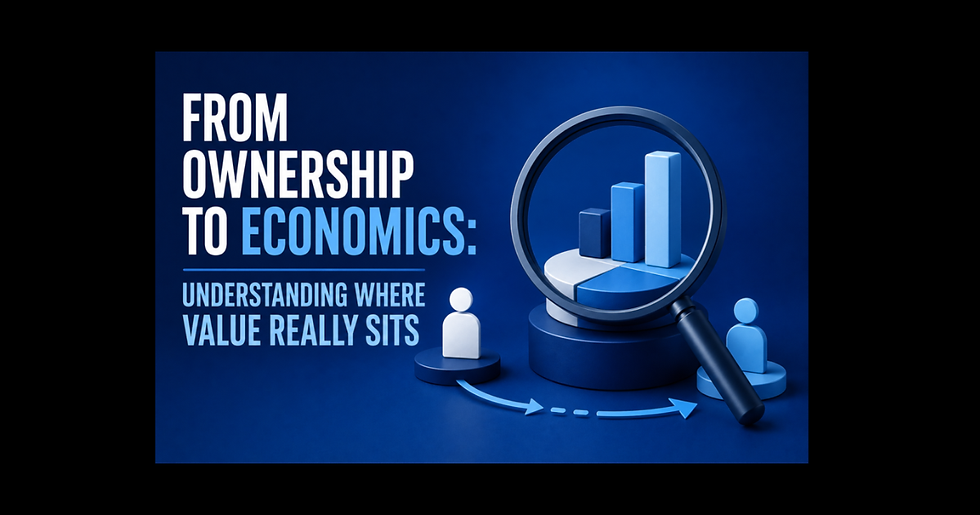
Rethinking the Cap Table: From Historical Ledger to Forward‑Looking Payout Economics
- Feb 17
- 3 min read

Most founders and investors treat the cap table as a static artefact, a tidy ledger of who owns what, how much they paid, and how those numbers stack up today. Useful, yes, but also deeply incomplete.
Over the past months I’ve written a lot about fair value and how it offers a window into what might be, not just what is. Recently people have asked me: “If you’re doing this for VCs, what about the other side of the equation - the company?”
The Traditional View: A Backward-Looking Document
Most cap tables are treated like a P&L statement:
A record of past transactions
A snapshot of current ownership
A list of prices paid
Some go a level deeper and use the cap table to model outcomes. If you know the preferences, rights, and mechanics of each share class, you can calculate who gets what at a given exit. More sophisticated teams even model future rounds and dilution scenarios.
But all of this is still fundamentally reactive.
There is though, a more powerful way to think about this.
Introducing Breakpoints: The Forward-Looking Side of the Cap Table
A breakpoint is the moment when the next dollar of value flows to a different asset/share class. It’s the point where the distribution “switches lanes.”
Here’s the key insight: Breakpoints and the cap table are not separate concepts. Breakpoints are simply the cap table expressed in its future tense.
The cap table tells you where ownership sits today. Breakpoints tell you how the value of that ownership unfolds tomorrow.
If the cap table is the historical ledger, breakpoints are its mathematical extrapolation. The same data, but viewed through a forward‑looking lens.
To calculate breakpoints, you need:
Full details of every share class
All rights and preferences
A mathematical engine that can compute the exact points where distributions shift
Once you have that, something interesting happens: You can see, with precision, who participates at each breakpoint and how much value they capture.
In other words, you can see what you are worth as the EV (Enterprise Value) grows/changes, not just at a hypothetical exit.
Why Breakpoints Matter
Breakpoints reveal things a traditional cap table hides:
When common actually starts participating
When early investors are fully paid out
When later investors overtake earlier ones
How ESOP interacts with different valuation levels
Where allocation “kinks” occur because of preferences or structure
It’s not linear, and that’s the point. Between breakpoints, the distribution can bend, flatten, or accelerate That’s why the breakpoint itself is the meaningful unit of analysis.
A Few Important Nuances
Breakpoints aren’t perfect, and they aren’t static:
ESOP changes (vesting, unallocated pools, strike prices) can shift the curve
New rounds introduce new breakpoints
Rights, preferences, Safes and warrants can create non‑linear jumps – as above, sometimes making the ‘between breakpoints’, behave nothing like a straight line.
But even with these caveats, breakpoints give founders and boards something they’ve never really had: A forward‑looking, mathematically grounded view of value distribution.
Why This Matters for Companies, Shareholders, and VCs
Breakpoints give everyone around the table, founders, employees, investors etc a clear understanding of what to expect and what they’re working toward.
They show:
When different stakeholders begin to participate
How value flows as the company grows
How hitting a milestone that changes the company value, actually changes the economics of who gets what.
Where incentives align or diverge
For CEOs and CFOs, this becomes a strategic tool. It informs hiring, compensation, fundraising, board conversations, and long‑term planning.
Every startup leadership team should have this capability. Not because it’s a financial curiosity, but because it reveals how the value you’re building will ultimately be shared and what it will take to get there.


Comments