
How Robust Is Your Fund’s NAV?
Updated: Jul 24

One investment. Five valuation approaches. Values from $2.00 million to $4.09 million.
Over the past few months, I’ve written extensively about venture capital fair value.
We’ve explored valuation methodologies, shareholder rights, breakpoints, waterfalls, calibration, back-solve, OPM, PWERM, CVM, ASC 820, the IPEV Guidelines and AICPA guidance.
Each topic is important.
But none of them are the end goal.
Ultimately, venture capital funds don’t report OPMs, waterfalls or calibration analyses.
They report NAV.
And for most venture capital funds, NAV is driven primarily by the fair value of the underlying portfolio investments.
✅ GPs make investment decisions using it.
✅ LPs assess fund performance using it.
✅ CFOs report it.
✅ Auditors review it.
Which raises a simple question:
How robust is your fund's reported NAV?
To explore that question, consider a simple example.
A venture fund invests $2.0 million in a Series A financing, purchasing 200,000 preferred shares at $10.00 per share.
Two years later, the company completes an independent Series B financing at $20.00 per share.
The financing closes only a few months before the valuation date, and there have been no other material changes to the business.
So the question seems straightforward:
What is the fair value of the original Series A investment?
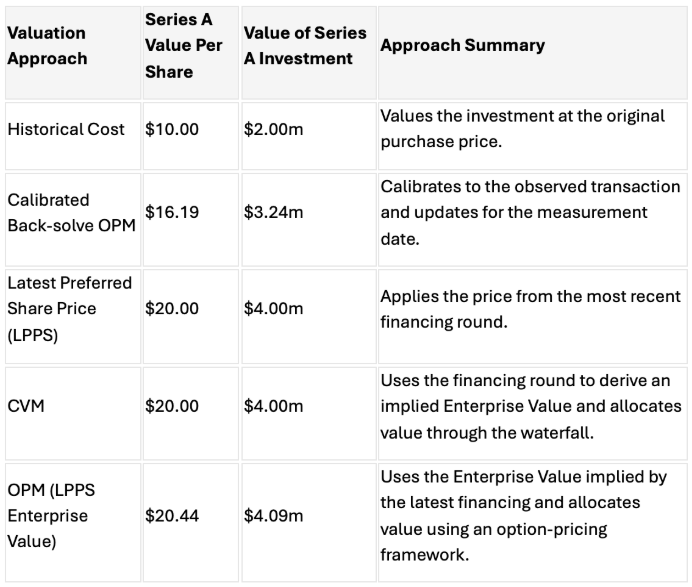
Depending on the valuation approach used, the answer ranges from $2.00 million to $4.09 million.
The Same Investment. Five Different Values.
The Result
The difference between the highest and lowest value produced for the same investment - $2.09 million.
A 104% difference.
The company didn’t change.
The financing round didn’t change.
The capital structure didn’t change.
Only the valuation approach changed.
Even the two OPM approaches produced materially different outcomes:
• Calibrated Back-solve OPM: $3.24 million
• OPM using LPPS-derived Enterprise Value: $4.09 million
If that level of variation is possible for a single investment, what confidence should we have that the total value of an entire portfolio, and therefore the fund's reported NAV, is truly robust?
Closing Observation
A single investment in this example produced values ranging from $2.00 million to $4.09 million.
The variation was driven by the way the same underlying facts would have been interpreted through different valuation approaches.
If that level of variation can exist within a single investment, it is worth considering what the cumulative impact might be across an entire portfolio.
And that brings us full circle.
This is precisely why frameworks such as ASC 820, the IPEV Guidelines and the AICPA
guidance exist.
Not to prescribe a particular methodology or promote one model over another.
Rather, they provide a framework for determining which valuation approach best represents fair value under different and specific circumstances.
Because ultimately, venture capital funds don't report OPMs, PWERMs, CVMs or waterfalls.
They report NAV.
And the robustness of that NAV can never be greater than the robustness of the fair values assigned to the underlying investments.
Appendix: The Numbers Behind the Example
For those interested in the valuation mechanics, the assumptions for the example were intentionally simplified.
Series A Financing
• 200,000 Series A Preferred Shares
• $10.00 per share
• Total investment: $2.0 million
Series B Financing
• 200,000 Series B Preferred Shares
• $20.00 per share
• Total investment: $4.0 million
Capital Structure
• 1,000,000 Ordinary Shares
• 200,000 Series A Preferred Shares
• 200,000 Series B Preferred Shares
• 60,000 ESOP
Additional Assumptions
• 1x non-participating liquidation preference for both preferred series
• 70% volatility
• 4-year expected time to exit
• Prevailing risk-free interest rate
At first glance, it may seem surprising that LPPS and CVM produced the same value in this example.
However, they arrived there differently.
• LPPS simply applies the latest observed transaction price.
• CVM uses that transaction to derive an implied Enterprise Value of approximately $29.2 million and then allocates that value through the contractual rights embedded in the capital structure.
In this particular example, both approaches happened to produce the same value for the Series A shares.
That will not always be the case.
Similarly, the two OPM approaches produced materially different answers despite using the same company, financing round and capital structure.
The key difference was how the observable market evidence was incorporated into the analysis and whether the model was calibrated before being applied.
The objective is not to suggest that one methodology should always be preferred over another.
Every investment must be assessed based on its own facts and circumstances.
Rather, the purpose of this example is to demonstrate how different valuation approaches—and different applications of the same observable market evidence—can produce materially different answers for exactly the same investment.


Comments